නිදහස් හා විවෘත ප්රවේශය
රාජ්ය මූල්ය දත්ත හා විශ්ලේෂණයන් සඳහා

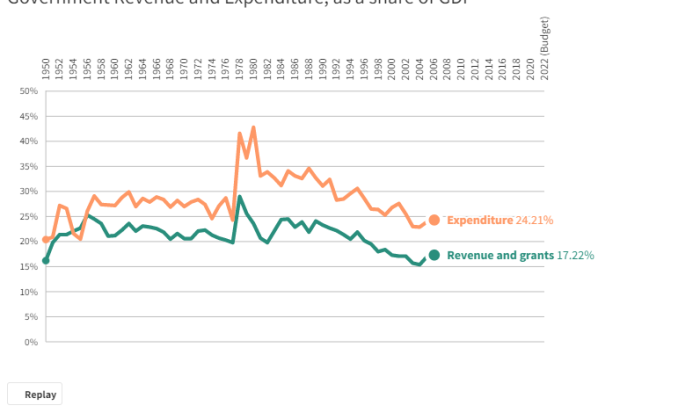
The following chart displays the government revenue and expenditure as a share of GDP from 1950 to 2022. Move across the year axis to select a year and view the values for that respective year.