Public Finance Data and Analysis
Free and Open Access to

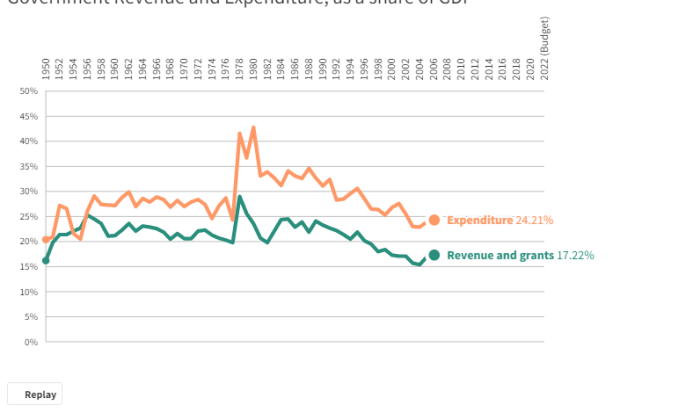
The following chart displays the government revenue and expenditure as a share of GDP from 1950 to 2022. Move across the year axis to select a year and view the values for that respective year.