Public Finance Data and Analysis
Free and Open Access to

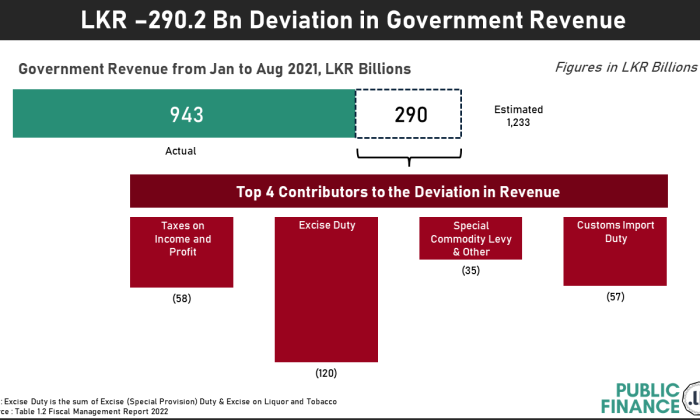
This infographic depicts the deviation in revenue from the estimated revenue.
Note : Breakdown of government revenue deviation as per the Fiscal Managemnt Report 2022.
| Jan-Aug | Deviation | ||
| Estimated | Actual(a) | ||
| Total Revenue | 1,232.70 | 942.5 | -290.2 |
| Tax Revenue | 1,117.00 | 853.1 | -264 |
| Inland Revenue Department | |||
| Taxes on Income and Profit | 233.5 | 175.1 | -58.3 |
| Value Added Tax (VAT) - Domestic (Net) | 119.9 | 119.4 | -0.6 |
| Other | 2.6 | 22.7 | 20.1 |
| Sub Total | 356 | 317.2 | -38.8 |
| Sri Lanka Customs Department | |||
| Customs Import Duty | 117.5 | 60.9 | -56.6 |
| Value Added Tax - Imports (Net) | 71.5 | 80.2 | 8.7 |
| Ports & Airports Development Levy | 112.9 | 92 | -20.8 |
| CESS Levy | 46.1 | 51.2 | 5.1 |
| Special Commodity Levy & Other | 73.1 | 37.8 | -35.3 |
| Excise (Special Provisions) Duty | 211.5 | 108.8 | -102.8 |
| Cigarettes | 87.7 | 55.2 | -32.5 |
| Petroleum Products | 56.3 | 37.5 | -18.8 |
| Motor Vehicles | 60.9 | 11.6 | -49.3 |
| Other | 6.6 | 4.5 | -2.1 |
| Other | 1.3 | 0.1 | -1.2 |
| Sub Total | 633.9 | 431.1 | -202.8 |
| Excise Department | |||
| Liquor/Tobacco | 106.2 | 89.4 | -16.8 |
| Sub Total | 106.2 | 89.4 | -16.8 |
| Other | |||
| Telecommunication Levy | 13.3 | 9.5 | -3.8 |
| Licence Tax & Other | 7.7 | 5.9 | -1.8 |
| Sub Total | 21 | 15.4 | -5.6 |
| Non-Tax Revenue | 115.6 | 89.4 | -26.2 |