Public Finance Data and Analysis
Free and Open Access to

| Owner | 2000 | 2001 | 2002 | 2003 | 2004 | 2005 | 2006 | 2007 | 2008 | 2009 | 2010 | 2011 | 2012 | 2013 | 2014 | 2015 | 2016 | 2017 | 2018 | 2019 | 2020 | Source | 2019 | 2020 | 2021 | 2022 | 2023 (b ) (c ) | ||||
|---|---|---|---|---|---|---|---|---|---|---|---|---|---|---|---|---|---|---|---|---|---|---|---|---|---|---|---|---|---|---|---|
| 0 | 1. Multilateral | 250096 | 289686 | 341326 | 405156 | 477079 | 459837 | 534356 | 580719 | 618181 | 665040 | 674936 | 721916 | 844292 | 903540 | 887960 | 994430 | 1076549 | 1198243 | 1451443 | 1469867 | 1601482 | 1. Multilateral | 1469867 | 1601482 | 1895340 | 3611552 | 3816950 | |||
| 1 | ADB | 115353 | 136064 | 164017 | 195895 | 235741 | 230510 | 269211 | 292151 | 317763 | 344661 | 358872 | 383461 | 448421 | 478796 | 471762 | 533806 | 569686 | 632237 | 785509 | 802047 | 865457 | ADB | 802047 | 865457 | 1052418 | 2049154 | 2018389 | |||
| 2 | EIB | - | - | - | 599 | 3545 | 4838 | 9345 | 15326 | 18010 | 20463 | 18792 | 18054 | 23438 | 23248 | 21133 | 29728 | 27518 | 29193 | 31255 | 27509 | 26810 | Asian Infrastructure Investment Bank | 127 | 1659 | 6346 | 24535 | 29718 | |||
| 3 | IBRD | 89 | 521 | 379 | 204 | 221 | 220 | 228 | 231 | 240 | 322 | 4530 | 6987 | 10382 | 27760 | 28462 | 37008 | 45769 | 56757 | EIB | 27509 | 26810 | 23913 | 37055 | 30176 | ||||||
| 4 | IDA | 129403 | 146853 | 169336 | 199782 | 226926 | 213916 | 242940 | 258748 | 267475 | 284074 | 281217 | 302244 | 349997 | 373085 | 363052 | 391149 | 417636 | 467832 | 548283 | 541074 | 593238 | IBRD | 45769 | 56757 | 104444 | 317507 | 322032 | |||
| 5 | IFAD | 4678 | 5532 | 6381 | 7116 | 7886 | 7109 | 7997 | 8719 | 9052 | 10309 | 11032 | 13007 | 16013 | 17419 | 17098 | 18631 | 21520 | 24405 | 28251 | 29417 | 32153 | IDA | 541074 | 593238 | 645476 | 1076448 | 1096485 | |||
| 6 | OPEC | 91 | 136 | 464 | 538 | 1329 | 1582 | 2098 | 2357 | 2355 | 2173 | 1913 | 2052 | 2699 | 2998 | 4783 | 7547 | 9309 | 12743 | 17398 | 20443 | 21686 | IFAD | 29417 | 32153 | 34186 | 58254 | 53812 | |||
| 7 | Nordic Development Fund | 482 | 580 | 749 | 1023 | 1431 | 1662 | 2537 | 3188 | 3285 | 3360 | 3110 | 3099 | 3403 | 3464 | 3145 | 3187 | 3119 | 3370 | 3741 | 3480 | 3722 | Nordic Development Fund | 3480 | 3722 | 3472 | 5566 | 4830 | |||
| 8 | 2. Bilateral | 277317 | 305511 | 349007 | 398925 | 465513 | 433382 | 486530 | 564500 | 666533 | 684750 | 739213 | 842804 | 1035907 | 823180 | 793196 | 888971 | 945754 | 992157 | 1163265 | 1131911 | 1162973 | OPEC Fund for International Development | 20443 | 21686 | 25085 | 43035 | 40731 | |||
| 9 | Canada | 6219 | 6582 | 6626 | 7746 | 8521 | 8635 | 8753 | 9852 | 7718 | 8488 | 8134 | 7701 | 8269 | 7409 | 6339 | 5373 | 5275 | 5254 | 5230 | 4854 | 4502 | IMF EFF | - | - | - | - | 220776 | |||
| 10 | France | 5907 | 6439 | 7596 | 8735 | 10177 | 8726 | 9714 | 10255 | 12424 | 15021 | 18427 | 19503 | 24273 | 26861 | 24698 | 25406 | 24448 | 27977 | 32264 | 34202 | 38584 | 2. Bilateral & Financial Markets (d) | 4731416 | 4450698 | 4621618 | 8846603 | 7827145 | |||
| 11 | Germany | 28338 | 32953 | 39545 | 46657 | 56301 | 49374 | 61644 | 65977 | 61528 | 58279 | 50263 | 47547 | 51164 | 52112 | 43342 | 40726 | 39145 | 43506 | 46937 | 43113 | 45091 | Canada | 4854 | 4502 | 4212 | 6634 | 6026 | |||
| 12 | India | 1146 | 1855 | 2786 | 6702 | 10311 | 10118 | 12382 | 14843 | 15294 | 17902 | 17292 | 41927 | 78322 | 102843 | 119982 | 137413 | 142277 | 145071 | 166915 | 153075 | 146530 | China | 796919 | 932681 | 1139972 | 2506020 | 2227347 | |||
| 13 | Japan | 172932 | 185081 | 217151 | 255277 | 301434 | 277882 | 305897 | 327711 | 426936 | 426767 | 478931 | 529013 | 547515 | 468366 | 416408 | 457483 | 486199 | 506829 | 613656 | 617973 | 659260 | Export-Import Bank of China (e) | 476565 | 528403 | 549807 | 1464185 | 1299808 | |||
| 14 | Kuwait | 2180 | 2497 | 2884 | 2939 | 3388 | 3573 | 3794 | 3855 | 4649 | 5103 | 5237 | 5799 | 6194 | 5749 | 5357 | 6765 | 7774 | 8768 | 12124 | 13146 | 14866 | People's Republic of China | 2601 | 2859 | 3144 | 5219 | 4567 | |||
| 15 | Netherlands | 2505 | 2453 | 2610 | 2645 | 2574 | 2196 | 2080 | 1455 | 751 | 291 | 87 | 0 | 0 | 0 | 0 | 0 | 0 | 0 | 0 | - | China Development Bank Corporation | 136118 | 121806 | 116211 | 194325 | 173353 | ||||
| 16 | People's Republic of China | 2088 | 3219 | 3373 | 3115 | 3342 | 3604 | 5121 | 22668 | 29688 | 46641 | 56459 | 59497 | 67434 | 67154 | 87743 | 117284 | 131604 | 135728 | 150939 | 138720 | 124665 | HSBC Limited (Hongkong)-China | - | - | 25290 | 44702 | 39878 | |||
| 17 | Saudi Arabian Fund | 38 | 63 | - | - | - | 43 | 327 | 749 | 1217 | 2328 | 2338 | 2544 | 2648 | 3868 | 4982 | 10724 | 13255 | 16722 | 21752 | 23725 | 24085 | TLF China Development Bank | 181634 | 279612 | 445521 | 797589 | 709741 | |||
| 18 | USA | 51053 | 58064 | 57937 | 55229 | 57078 | 55341 | 57310 | 52797 | 50708 | 46952 | 42414 | 40318 | 41386 | 38854 | 35246 | 34594 | 31798 | 28295 | 28910 | 24381 | 20632 | France (f) (g) | 34202 | 38584 | 43178 | 79751 | 76172 | |||
| 19 | Other | 4911 | 6305 | 8499 | 9881 | 12387 | 13892 | 19508 | 54339 | 55619 | 56978 | 59633 | 88957 | 208702 | 49963 | 49100 | 53205 | 63978 | 74007 | 84537 | 78724 | 84758 | Germany | 43113 | 45091 | 41878 | 71427 | 66224 | |||
| 20 | 3. Financial Markets | 14627 | 41544 | 31624 | 39801 | 53547 | 63401 | 82533 | 181268 | 164020 | 410676 | 610433 | 764560 | 887100 | 1233704 | 1431959 | 1660630 | 2023493 | 2528218 | 3344839 | 3800660 | 3287725 | India | 156077 | 154512 | 166031 | 625004 | 442613 | |||
| 21 | Riggs National Bank | 965 | 3754 | 3831 | 3746 | 3980 | 3769 | 3843 | 3746 | 3674 | 3476 | 3140 | 2984 | 3064 | 2922 | 2651 | 2607 | 2336 | 2110 | 2262 | 1986 | 1767 | Export Import Bank of India | 3002 | 7983 | 162753 | 492689 | 282143 | |||
| 22 | Indosuez Bank (France and Stockholm) | 178 | 179 | 144 | 129 | 108 | 82 | 48 | 16 | - | 0 | 0 | 0 | 0 | 0 | 0 | 0 | 0 | 0 | 0 | - | Government of India | 153075 | 146530 | 3277 | 5227 | 4663 | ||||
| 23 | Bankers'Trust Co. | 896 | 977 | 948 | 877 | 876 | 786 | 754 | 685 | 634 | 560 | 466 | 399 | 356 | 275 | 184 | 101 | 0 | 0 | 0 | - | State Bank of India | - | - | - | 127089 | 155807 | ||||
| 24 | France | 979 | 837 | 158 | - | - | - | - | - | - | 0 | 0 | 0 | 0 | 0 | 0 | 0 | 0 | 0 | 0 | - | Japan | 617973 | 659260 | 621587 | 977336 | 817664 | ||||
| 25 | Solomon Bros. Inc. - New York | 869 | 923 | 868 | 774 | 739 | 627 | 560 | 462 | 374 | 270 | 157 | 54 | 0 | 0 | 0 | 0 | 0 | 0 | 0 | - | Kuwait | 13146 | 14866 | 18565 | 34761 | 30887 | ||||
| 26 | Citi Bank/NEXI | 0 | 0 | 0 | 9635 | 10433 | 18082 | 27122 | 24637 | 11314 | 0 | 0 | 0 | 0 | 0 | 0 | 201 | 0 | 0 | 0 | - | Riggs National Bank | 1986 | 1767 | 1605 | 2730 | 2435 | ||||
| 27 | Export-Import Bank of China | 0 | 0 | 0 | 0 | 0 | 0 | 0 | 0 | 0 | 0 | 0 | 0 | 0 | 0 | 146262 | 192889 | 242416 | 299405 | 392041 | 476565 | 528403 | Saudi Arabian Fund | 23725 | 24085 | 27426 | 50493 | 47956 | |||
| 28 | International Soveriegn Bonds | 54360 | 56570 | 114384 | 221906 | 341704 | 445063 | 457636 | 655243 | 958014 | 1220870 | 1475049 | 2220411 | 2733592 | 1796579 | USA (g) | 24381 | 20632 | 17808 | 30837 | 27509 | ||||||||||
| 29 | Foreign Currency Term Financing Facility | 104860 | 217054 | 330174 | 242191 | 279612 | Other (g) (h) (i) | 3015041 | 2554718 | 2539356 | 4461611 | 4082311 | |||||||||||||||||||
| 30 | Non Resident Investment in Treasury Bills | 6358 | 40410 | 57317 | 70123 | 80184 | 73916 | 55500 | 5045 | 12816 | 27552 | 11909 | 23727 | 670 | o/w International Sovereign Bonds | 2531493 | 2203279 | 2243049 | 3921587 | 3498371 | |||||||||||
| 31 | Non Resident Investment in Treasury Bonds | 49647 | 17647 | 145124 | 183538 | 199531 | 317604 | 403486 | 401710 | 298734 | 247222 | 295059 | 146914 | 80294 | 6204 | Total | 6201283 | 6052179 | 6516958 | 12458155 | 11644094 | ||||||||||
| 32 | Other | 10740 | 34874 | 25676 | 24640 | 37411 | 40055 | 50206 | 151722 | 148024 | 406370 | 606670 | 761124 | 883680 | 1230507 | 170410 | 203039 | 192973 | 211989 | 241128 | 242305 | 674490 | Sources: Ministry of Finance, Economic Stabilisation and National Policies | ||||||||
| 33 | Total | 542040 | 636741 | 721957 | 843882 | 996139 | 956620 | 1103419 | 1326487 | 1448734 | 1760466 | 2024582 | 2329280 | 2767299 | 2960424 | 3113115 | 3544031 | 4045796 | 4718618 | 5959547 | 6201283 | 6052179 | Central Bank of Sri Lanka | ||||||||
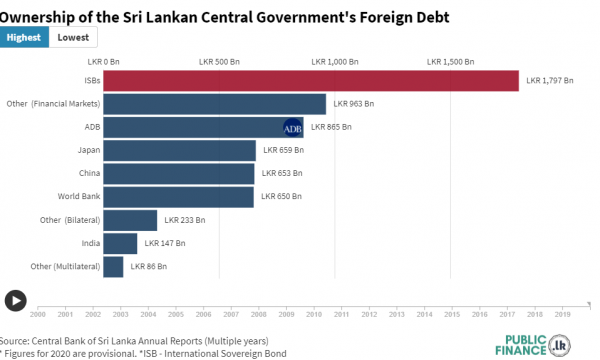
| 34 | (a) These figures may differ from those appearing in Appendix Table 16 in the printed version of the Annual Economic Review due to differences in classification. | ||||||||||||||||||||||||||||||
| 35 | SOE Foreign Debt | (b) Provisional | |||||||||||||||||||||||||||||
| 36 | (c) Based on CS-DRMS reports for end 2023 downloaded on 26.02.2024 | ||||||||||||||||||||||||||||||
| 37 | LKR Million | (d) The arrears interest payments as of 31.12.2022 and 31.12.2023 are not included. | |||||||||||||||||||||||||||||
| 38 | Ownership of Outstanding Foreign Debt | (e) Includes outstanding loans of projects under State Owned Business Enterprises (SOBEs) w.e.f. 31.12.2022 | |||||||||||||||||||||||||||||
| 39 | Source: Table 107, Statistical Appendix, CBSL Annual Report | (f) Includes loans from financial institutions of France | |||||||||||||||||||||||||||||
| 40 | (g) Revised | ||||||||||||||||||||||||||||||
| 41 | Note* Others exclude ISB, FCTFF, Treasury bills and Bonds. | (h) Includes rupee denominated Treasury bonds and Treasury bills held by non resident investors | |||||||||||||||||||||||||||||
| 42 | Note* This table discountinues after 2020 & CBSL introducused a new table from 2019 | (i) Includes Sri Lanka Development Bonds held by non resident investors and exclude international Sovereign Bonds held by resident investors |