Public Finance Data and Analysis
Free and Open Access to

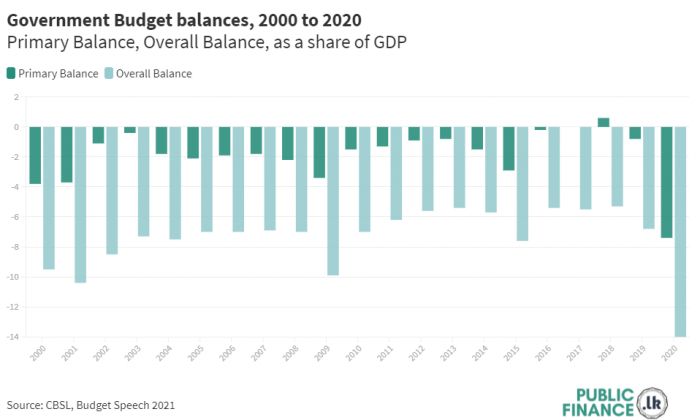
The bar chart illustrates the primary balance and overall balance as a share of GDP from 2010-2021. Hover over each bar to identify the respective balances as a share of GDP each year
Note: 2020 and 2019 budget deficit figures are different to that reported by the CBSL in 2020 Annual Report as the CBSL numbers are not consistent with the previous years, hence cannot be used for comparison across years. Refer our previous insight for more details on this https://publicfinance.lk/en/topics/2020-Records-the-Highest-Budget-Deficit-Since-1982-1620901757